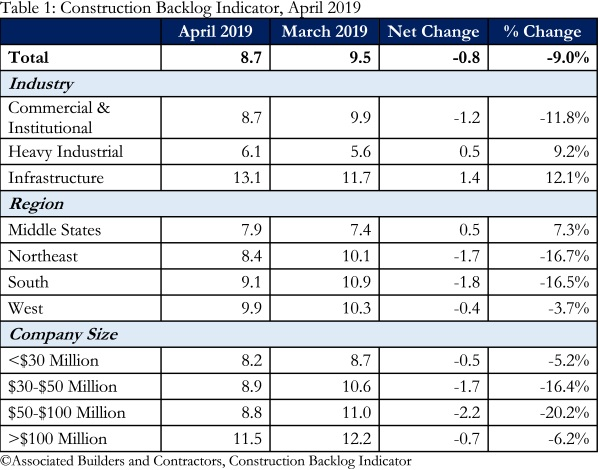
Associated Builders and Contractors (ABC) says its Construction Backlog Indicator fell to 8.7 months in April 2019, down 0.8 months or 9% since March, when CBI stood at 9.5 months.
“Given the ongoing expressions of confidence regarding near-term prospects in the U.S. nonresidential construction industry, the reduction in backlog observed in April shouldn’t be cause for alarm—especially with construction backlog significantly higher than at the onset of 2019,” said ABC chief economist Anirban Basu.
“The backlog decline in April was due to the commercial/institutional category,” said Basu. “This can be attributed to construction spending trends, which show that growth in certain commercial segments is not nearly as robust as in prior years. There are many potential explanations, including evidence suggesting that some banks have become increasingly wary of lending for commercial construction projects after years of rapid building and concerns regarding economic slowing.

“On the other hand, backlog in the heavy industrial and infrastructure categories actually rose in April,” said Basu. “Infrastructure spending in the United States is red hot right now, especially in categories such as highway/street, transportation and water supply. With the U.S. economy on the verge of 10 years of economic expansion, many state and local government finances are at their healthiest level in more than a decade, resulting in more funding available for infrastructure projects. There has also been a considerable appetite for the bonds often floated by governments to finance such projects.
“Regionally, backlog remains most elevated in the South and the West—both regions that are disproportionately home to the nation’s fastest expanding metropolitan areas,” said Basu. “Among the areas setting the pace are Dallas, Austin, Nashville, and other Southeastern and Western cities. That said, backlog declined in both the South and the West in April, perhaps an indication of growing concern regarding overbuilt markets.”


Your graph! How can you show quarters for 8 years then transition to months for the first four months of 2019. It should show the first quarter of 2019 with an average at 8.8 which is only down 1/10 of a point from the previous quarter. Constancy is most important when showing results on a graph.