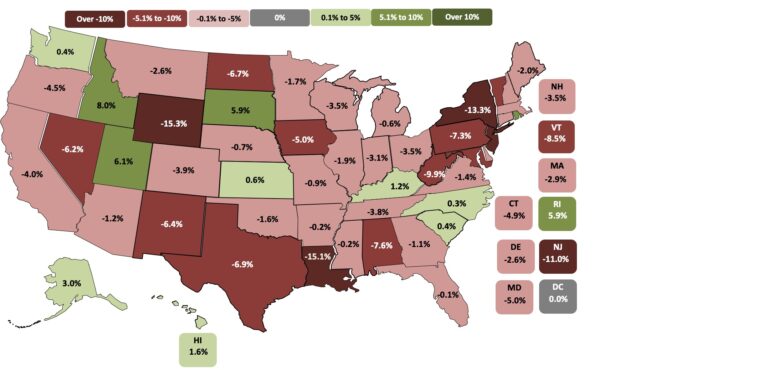
Florida’s construction employment picture in the 16 months of the COVID-19 pandemic depends where you are in the state.
Some communities have seen significant employment growth in the months between February 2020 and June 2021, others have experienced equally dramatic declines, according to data compiled by the Associated General Contractors (AGC) of America from government sources.
For example, the Miami metropolitan area reported an 8% decline, losing 5,200 jobs, while Palm Bay-Melbourne-Titusville saw a 9% increase, or 1,400 jobs. Statewide, the overall jobs growth is 2%. (In smaller markets, mining and logging are aggregated with construction.)
See the data by community below:
Numbers employed Feb. 2020; June 2021; change in past 16 months; percentage change in the past 16 months, national rank
- Statewide Construction 574,500 583,700 9,200 2%
- Statewide Mining, Logging, and Construction 580,000 589,200 9,200 2%
- Cape Coral-Fort Myers Mining, Logging, and Construction 33,100 35,500 2,400 7% 169
- Crestview-Fort Walton Beach-Destin Mining, Logging, and Construction 7,100 7,100 0 0% 258
- Deltona-Daytona Beach-Ormond Beach Mining, Logging, and Construction 14,200 15,000 800 6% 183
- Fort Lauderdale-Pompano Beach-Deerfield Beach Div.Construction 50,300 50,800 500 1% 245
- Gainesville Mining, Logging, and Construction 6,100 6,500 400 7% 169
- Jacksonville Construction 46,300 49,200 2,900 6% 183
- Lakeland-Winter Haven Mining, Logging, and Construction 14,900 15,900 1,000 7% 169
- Miami-Miami Beach-Kendall Div. Construction 54,400 50,200 -4,200 -8% 329
- Naples-Immokalee-Marco Island Mining, Logging, and Construction 17,400 18,300 900 5% 197
- North Port-Sarasota-Bradenton Mining, Logging, and Construction 26,700 27,800 1,100 4% 213
- Ocala Mining, Logging, and Construction 8,700 8,800 100 1% 245
- Orlando-Kissimmee-Sanford Construction 86,600 85,300 -1,300 -2% 289
- Palm Bay-Melbourne-Titusville Mining, Logging, and Construction 15,700 17,100 1,400 9% 137
- Panama City Mining, Logging, and Construction 7,100 7,600 500 7% 169
- Pensacola-Ferry Pass-Brent Mining, Logging, and Construction 12,100 12,500 400 3% 223
- Port St. Lucie Mining, Logging, and Construction 12,400 13,400 1,000 8% 154
- Punta Gorda Mining, Logging, and Construction 4,400 4,600 200 5% 197
- Sebastian-Vero Beach Mining, Logging, and Construction 4,500 4,800 300 7% 169
- Tallahassee Mining, Logging, and Construction 8,500 8,500 0 0% 258
- Tampa-St. Petersburg-Clearwater Construction 84,700 87,600 2,900 3% 223
- West Palm Beach-Boca Raton-Delray Beach Div. Construction 37,900 38,000 100 0% 256
Nationally, construction employment declined or stagnated in 101 metro areas between February 2020 and June 2021, AGC reported in its July 28 analysis.
Association officials said that labor shortages and supply chain problems were keeping many firms from adding workers in many parts of the country.
“Typically, construction employment increases between February and June in all but 30 metro areas,” said Ken Simonson, the association’s chief economist. “The fact that more than three times as many metros as usual failed to add construction jobs, despite a hot housing market, is an indication of the continuing impact of the pandemic on both demand for nonresidential projects and the supply of workers.”
Eighty metro areas had lower construction employment in June 2021 than February 2020, while industry employment was unchanged in 21 areas. Houston-The Woodlands-Sugar Land, Texas lost the most jobs: 33,400 or 14 percent. Major losses also occurred in New York City (-22,000 jobs, -14 percent); Midland, Texas (-9,300 jobs, -24 percent); Odessa, Texas (-7,900 jobs, -38 percent) and Baton Rouge, La. (-7,700 jobs, -16 percent). Odessa had the largest percentage decline, followed by Lake Charles, La. (-34 percent, -6,700 jobs); Laredo, Texas (-25 percent, -1,000 jobs); Midland; and Longview, Texas (-22 percent, -3,300 jobs).
Of the 257 metro areas—72 percent—added construction jobs over the February 2020 level, Chicago-Naperville-Arlington Heights, IL. added the most construction jobs over 16 months (14,300 jobs, 12 percent), followed by Minneapolis-St. Paul-Bloomington, Minn.-Wis. (13,800 jobs, 18 percent); Indianapolis-Carmel-Anderson, Ind. (10,700 jobs, 20 percent); Warren-Troy-Farmington Hills, Mich. (9,300 jobs, 18 percent); and Pittsburgh, Pa. (7,600 jobs, 13 percent). Fargo, N.D.-Minn. had the highest percentage increase (50 percent, 3,700 jobs), followed by Sierra Vista-Douglas, Ariz. (48 percent, 1,200 jobs); Bay City, Mich. (45 percent, 500 jobs); St. Cloud, Minn. (39 percent, 2,400 jobs) and Kankakee, Ill. (36 percent, 400 jobs).
Association officials urged Congress and the Biden administration to make new investments in workforce development and to take steps to address supply chain issues. “They called for additional funding for career and technical education; they noted that craft training receives only one-sixth as much federal funding as college preparation.” They also continued to call on the president to remove tariffs on key construction materials like steel and aluminum.
“Federal officials may talk about the value of craft careers like construction, but they are failing to put their money where their mouth is,” said Stephen E. Sandherr, the association’s chief executive officer. “Until we expose more people to construction careers, and get a handle on soaring materials prices, the construction industry is likely to have a hard time recovering from the pandemic.”